 BallotbyMail.org
Maps
Every map here is free to use and republish, including commercially — no attribution required, though a link is welcome. Each one downloads as a PNG or an SVG, and each is built from the same verified data the rest of the site uses.
The whole country
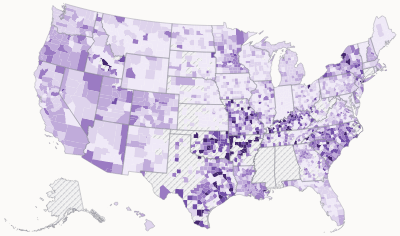 Rejection rates by county
All 3,143 counties, 2,538 with enough returned ballots to rate. Nationally 1.22% of returned mail ballots were rejected; the highest county was 24.86%.
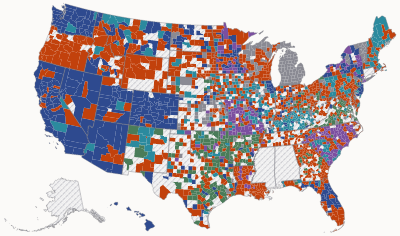 Why ballots were rejected
The single biggest reason in each of 2,407 counties. Arriving late tops 40% of them — about as many as every signature problem put together.
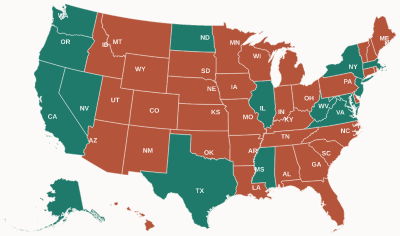 Does a postmark save your ballot?
In 35 states the ballot must ARRIVE by Election Day. In 16 a postmark is enough. The rule people get wrong most often.
One state at a time
- Alabama
- Alaska
- Arizona
- Arkansas
- California
- Colorado
- Connecticut
- Delaware
- District of Columbia
- Florida
- Georgia
- Hawaii
- Idaho
- Illinois
- Indiana
- Iowa
- Kansas
- Kentucky
- Louisiana
- Maine
- Maryland
- Massachusetts
- Michigan
- Minnesota
- Mississippi
- Missouri
- Montana
- Nebraska
- Nevada
- New Hampshire
- New Jersey
- New Mexico
- New York
- North Carolina
- North Dakota
- Ohio
- Oklahoma
- Oregon
- Pennsylvania
- Rhode Island
- South Carolina
- South Dakota
- Tennessee
- Texas
- Utah
- Vermont
- Virginia
- Washington
- West Virginia
- Wisconsin
- Wyoming
Using these
Newsrooms, election offices and campaigns are all welcome to use them. If you need a cut we haven't published — a different state, a different year, the underlying numbers — ask: press@ballotbymail.org. The data behind them is at /api/wikidata, public domain.